Why A PRTG Sensor?
I was in a meeting with a good customer of Pure Storage when I noticed that their operational panel on the floor was showing a PRTG dashboard. The
PRTG Network Monitor tool from
Paessler is a very nice agentless monitoring solution that is able to utilise a wide range of methods to monitor any accessible system or application on your network. It is a Windows based solution but supports all required methods to gain remote insights into your services such as SNMP, SSH, Scripts, REST, WMI, packaet sniffing, etc.
I am familiar with PRTG as I use it at home to monitor my home network and various components. This is possible due to the fact that you can run 100 sensors on a free license. The wonderful world of home automation and online media have made my network as critical to my household as it is for corporatations own services. Plus it is also fun to work with solutions like this, not to mention that it provides some interesting insights into your home network when combined with a
Ubiquiti setup.
Anyway back to the task in hand, I thought that looking at how we could monitor Pure FlashArray's with PRTG could both help me to familiarise myself with the Purity API. It turns out we do have a couple of options at the Pure OpenSource community
Pure/Code within the
Python and
PowerShell script packs written by some clever dudes in Pure (nod to
Barkz). The only consideration for these was that they are focused on the array level performance metrics, where I wanted to see what else we can keep an eye on. Also, as a new Pure employee, as stated prior, it also gives me the chance to work with the Restful API of Purity.
I can say that writing this sensor was a bit of fun and the Restful API of Purity has to be one of the most logical I have worked with. Very simple in structure, versioned to allow for supportability across a range of Purity versions, and a rich capability around those supporting actions such as filtering. It took no time at all to get comfortable with the structure, limits were only my own and those discovered within PRTG.
So What Does It Do?
I wanted to provide a good overview of the current operational health of the arrays monitored while ensuring that the reporting was not overly complicated. As a first release my focus is on array level conditions covering:
- Array capacity status
- Array performance metrics
- General hardware status of Controllers, Shelves and Chassis
- General drive health
 |
| Array object sensor summary page |
I have plans to add further granularity to cover '
volume performance', '
host performance' and '
protection compliance' in upcoming releases, but with the current method there is a limit of 50 channels to one sensor so still determining the best way to meet the number of instances required to monitor at that level and how to cater for lifecycle of objects that are subjected to CRUD operations (well create, update, delete anyway.
With the current script, the sensor reads the metrics from the array via a PowerShell script that directly queries each arrays Restful API. Although there is only a single script, it supports the multiple sensors through the '
Scope' parameter provided within the
arguments section of each sensor (more details in installation instructions).
Each sensor can contain one or more channels, a channel can be thought of as a single value aligned to the sensor such as '
capacity consumed' within the '
capacity' sensor. Then as appropriate limits are assigned to the channel that define the thresholds that a channels value goes either above (maxlimit) or under (minlimit) to raise a warning or error condition for the sensor. Some channels have explicit limits set such as those related to capacity and health but others, such as the performance metrics, are left to self determine when an exceptional condition occurs based on operational patterns already recorded. For example latency may stay steady under a millisecond for normal operations but if suddenly it increases to 20 milliseconds for multiple recordings, PRTG will determine this to be an exception and raise a warning condition.
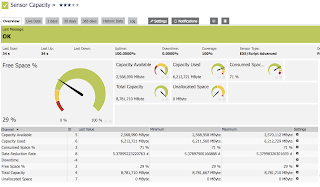 |
| Array capacity sensor |
Because each channel needs to provide a value that supports numeric comparisons to determine if limits are met, textual values returned from the array had to be converted to a representative numeric value. The textual values such as for Hardware components status to be reported as '
healthy', is enabled through the use of lookup tables included in the pack. Currently there are two included which provide lookup values for the channels in the '
Drive Health' and '
Hardware Health' sensor status values
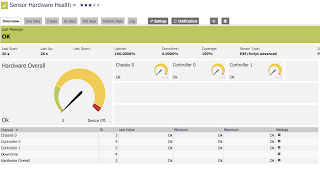 |
| Array Hardware Sensor |
Where the Array performance and capacity sensors provide a collection of metrics related to the sensors scope of the whole array, the health sensor for hardware provides summary graphs for each major component (Chassis, Controller, Shelf) and for the Drive Health sensor, a status for each drive.
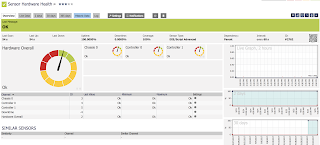 |
| Hardware Health Sensor |
For the Hardware Health sensor, summary values were required as reporting each individual hardware component that can be monitored exceeds the 50 channel to a sensor limit (not enforced but supportability and reliability can be compromised). I open to looking at alternative methods that can allow for all components to be individually reported in the future.
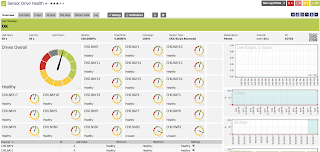 |
| Drive Health Sensor |
Installation
Requirements
- First, get the scripts and associated lookup files from GitHub at Pure Storage Sensor Module. This will provide a Zip file of the required files but you can also download it directly from the GHitHub site at 'https://github.com/davlloyd/purestorage-prtg'
- This set contains 4 files including:
- Get-PureFA-Sensor.ps1 - The main PowerShell script
- prtg.standardlookups.purestorage.drivestatus.ovl - Drive status lookup file
- prtg.standardlookups.purestorage.hardwarestatus.ovl - Hardware status lookup file
- readme.md - Markdown file with Installation instructions
- The Powershell script and lookup files need to be copied onto the PRTG server and then associated sensors created accordingly.
- Ensure the PRTG server (or PRTG probe if running sensor from a probe)is running PowerShell 4.0
Script Installation
- Copy the script Get-PureFA-Sensor.ps1 to the directory 'C:\Program Files (x86)\PRTG Network Monitor\Custom Sensors\EXEXML'
- Copy the two lookup files prtg.standardlookups.purestorage.drivestatus.ovl and prtg.standardlookups.purestorage.hardwarestatus.ovl to the directory 'C:\Program Files (x86)\PRTG Network Monitor\lookups\custom'
- Restart the Windows service 'PRTG Core Server Service'. This step is required to have PRTG read in the new custom lookup files
Sensor Creation
- Create a new device in PRTG with the address (IP or FQDN of the FlashArray you want to monitor
- Now, select <Add Sensor>. On the search field, type "Script Advanced" and then select the sensor type <EXE/Script Advanced Sensor> from the result list.
- On the Add Sensor to Device screen, enter the following:
- The sensor's name and tags (optional): There are currently four sensors to create. I have been naming them as follows:
- Capacity
- Performance
- Drive Health
- Hardware Health
- Under Exe/Script, use the Drop-down to select the script 'Get-PureFA-Sensor.ps1' from the list.
- Set the parameters for Array access and sensor scope as follows
- [ArrayAddress] (use the PRTG variable '%host' to inherit from device entry
- Either of the following combinations for security authentication:
- [username] and [password] - This is ok for testing purposes but as password is stored in clear text not recommended for production. This will generate or read the APIKey for the account
- [apikey] - preferred access method. The APIKey is generated from within the Purity Console for the preferred account. You do not need to enter account details if specifying an APIKey
- [Scope] to set what is monitored for this sensor. Scope option values are:
- capacity
- performance
- hardware
- drive
- By default the sensors will be run every 60 seconds, adjust accordingly. You can get a view of time for execution by running the scripts in debug mode but ensure that it is disabled when running the script as a sensor.
| -arrayaddress '%host' -scope 'hardware' -apikey '3bdf3b60-f0c0-fa8a-83c1-b794ba8f562c' |
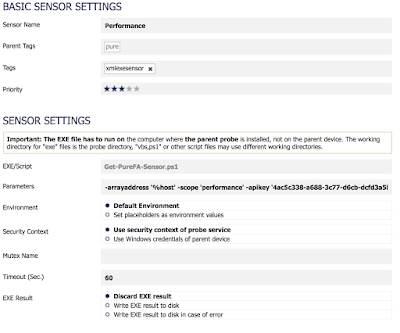 |
| Sensor Setup |
You are now ready to go. For a look at how to set a sensor up watch the video on this blog.
 |
| Sensor Screen |
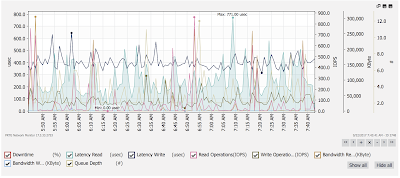 |
| Performance Chart |


Hi David
ReplyDeleteNice one! That just saved me a lot of work, many thanks!
Just one question, the Data Reduction is always reported as 0 in my environment. Purity is 4.10.8 and PRTG is 17.4.36.3670.
Any idea?
Cheers,
Roman
Hi Roman,
DeleteSorry to hear that the reduction rate is not being reported. It may be worthwhile looking at the API version setting that the script is currently configured for (default set to 1.6) and lift it up to a more recent version to see if the value returns (change the variable on line 152 - $apiversion = "1.6). The query is not raising an exception otherwise you would get a message.
Sorry but I can not test the change myself as I do not have access to a Pure FlashArray anymore.
Pure returns dedup rate as float but script codes it as integer so PRTG returns 0. Look for the lines calculating dedup rate and change float 0 to float 1. You can use powershell round function to trim the decimal places. I also uncommented the lines that hide dedup from graphs/table. Hope this helps someone in the future
Delete$sensoroutput += Get-ResultElement `
-channel "Data Reduction Rate" `
-value ([System.Math]::Round($arrayspace[0].data_reduction,1)) `
-float 1 `
-decimalmode 1 `
#-showchart $false `
#-showtable $false
Hi David,
ReplyDeleteI've tried adding this but I getting an XML error - any ideas?
XML: The returned XML does not match the expected schema. (code: PE233) -- JSON: The returned JSON does not match the expected structure (Invalid JSON.). (code: PE231)
Hi Luke,
DeleteIs this against a new version release of Purity//FA? Do you get the error across all the values if you run the scrupt stand-alone and set the debug variable to true (this will print out to console each queried section)
Try this:
Deletehttps://dirkpaessler.blog/2019/01/28/pe233-and-pe231-error-with-a-powershell-script-for-a-custom-xml-sensor-for-prtg/
I just wanted to update the I'm running PRTG 21.3.69.1333+ on Windows Server 2019 with a probe on Windows 10. This powershell fix took care of my issues as well however I also had to remove the scope variable mentioned below.
DeleteGetting that error also - any solution to it?
ReplyDeletehi, i also geht the same error, i am running Purity Version 5.1.2, any ideas?
ReplyDeletekind regards, sebastian
This may help, I have Purity 5.0.8.
ReplyDeleteI ran Get-PureFA-Sensor.ps1 from a command prompt as follows:
.\Get-PureFA-Sensor.ps1 -arrayaddress 'array.com' -apikey 'xxxxx-xxxxx' -Scope 'Capacity' and it kept returning a scope parameter error on line 254.
I removed the -Scope parameter from the end of line 254 and it no longer errors; Set-Variable scope not needed.
The line is now as below.
254: Set-Variable -Name APIKey -Value $APIKey
Hope this help someone.
Saxon
Thanks mate.
DeleteCommented this line and no errors since then.
Thanks David, excellent script.
ReplyDeletewhy does unallocated space show a value of 0?
ReplyDeleteAlso why does data reduction rate show a value of 0
this is why i'm seeing on my side after implementing the script.
DeleteI am pretty sure David's said customer was me :)
ReplyDeleteWe have been happily using David's script for a while.
However, I needed to extend it a bit further (for example: FAN status, RW and IOPS performance per volume, etc). I am rubbish at powershell, so I decided to write one up on python.
https://github.com/tonkotsurobot/prtg-pure-storage
This comment has been removed by the author.
ReplyDeleteAwesome work here, and @Edward I will look into your Python scripts to add more functionality. Has anyone here by chance done something similar with FlashBlade REST API 1.6? I'm in need of that now.
ReplyDeleteNice article. It's very helpful to me. Thank you for share with us. Can you please check my article Software company website schema code for SEO.
ReplyDeleteHello, an amazing Information dude. Thanks for sharing this nice information with us. Designing and Implementing an Azure AI Solution course AI-100
ReplyDeleteNice information provided by you, it really helped me to understand this topic. I have also referred this article to my friends and they also enjoyed this informative post.<a href="https://vstpromax.com/prtg-network-monitor-crack-torrent-new/ vstpromax.com</a>
ReplyDeletePRTG Network Monitor Crack I am very impressed with your post because this post is very beneficial for me and provide a new knowledge to me
ReplyDeleteThanks for sharing the crack but you need to update this version because here new version Available below;
ReplyDeletehttps://licensedinfo.com/prtg-network-monitor-crack/
PrTG Network Monitor 21.4.72.1649 Crack
ReplyDeleteIn the same way, PRTG Network Monitor Full Torrent can export monitoring data in the form of CSV, HTML, PDF, XML, etc. for an in-depth analysis.
PRTG Network Monitor 21.4.72.1649 Crack
ReplyDeleteAll numbers, graphs, facts, and figures are one hundred percent reliable, ultimately setup becomes easy. In the same way, in PRTG Network Monitor Full Torrent you can export monitoring data in the form of CSV, HTML, PDF, XML, etc. for an in-depth analysis.
Thanks For Sharing, Here New Version Available;
ReplyDeletehttps://licensedinfo.com/prtg-network-monitor-crack/
So nice I am enjoying for that post as for u latest version of this Security tool Available
ReplyDeletecrackandpatch.com
Thank you for the information you provide, it helped me a lot. I hope to have many more entries or so from you. Your post are so good. Your work is amazing. You can also check out vstfull Crack for Free. You can also visit the
ReplyDeletefaisaltechs.com
PRTG Network Monitor Crack
Adobe Photoshop CC Crack
PowerISO Crack
Nikon Camera Control Pro Crack
RogueKiller Crack
This site have particular software articles which emits an impression of being a significant and significant for you individual, able software installation.This is the spot you can get helps for any software installation, usage and cracked.
ReplyDeleteprtg-network-monitor-free download
ReplyDeleteAmazing blog! I really like the way you explained such information about this post with us. And blog is really helpful for us this website
prtg-network-monitor-crack/
PRTG Network Monitor 21.8.0 Crack is a compelling network monitoring service that gives real-time traffic statistics.
ReplyDeletehttps://softwaregurucrack.com/prtg-network-monitor-crack/
Great set of tips from the master himself. Excellent ideas. Thanks for Awesome tips Keep it up
ReplyDeleteprtg-network-monitor-crack
I guess I am the only one who came here to share my very own experience. Guess what!? I am using my laptop for almost the past 2 years, but I had no idea of solving some basic issues. I do not know how to Crack But Thankfully, I recently visited a website named Cracked Fine
ReplyDeletePrtg Network Monitor Crack
Privatevpn Crack
Allavsoft Video Downloader Converter Crack
webcammax Crack
ReplyDeleteI thought this was a pretty interesting read when it comes to this topic. Thank you
utorrent-pro-crack
openshot-video-editor-crack/
prtg-network-monitor-crack
I like your all post. You have done really good work. Thank you for the information you provide, it helped me a lot. prosvst.com I hope to have many more entries or so from you.
ReplyDeleteVery interesting blog.
PRTG Network Monitor Crack
So nice I am enjoying for that post as for u latest version of this Security tool Available
ReplyDeleteprtg-network-monitor-crack
ReplyDeleteI like your all post. You have done really good work. Thank you for the information you provide, it helped me a lot. wahabtech.net I hope to have many more entries or so from you.
Very interesting blog.
PRTG Network Monitor Crack
someone has one for purestorage flashblade? or is it similiar to flasharray? kind regards
ReplyDeleteIn case you still need:
Deletehttps://github.com/evandrotex/prtg-pure-storage
After upgrading Purity to 6.5.2 I get the following error message:
ReplyDeleteArray Details Query Failed: The underlying connection was closed: An unexpected error occurred on a send.
Before the upgrade the script worked very well. Can someone help me?
Same error, both problem...
DeleteAlso commented line 216 about Queue depth. Looks
DeleteI made a fork from tonkotsurobot python project. Also added a flashblade script:
Deletehttps://github.com/evandrotex/prtg-pure-storage
AVS Video Editor Keygen 2025 enables you to use consequence also payment, storage carte du jour, music, tube. This software is similar cooperative for burning up.
ReplyDeleteAVS Video Editor Crack
Adobe Camera Raw Crack is capable visual studio put in simply attach to inside jpeg as well as effortless convenience to the majority significant digital gadget for optimizing graphics presentation.
ReplyDeleteAdobe Camera Raw Crack